Welcome to Informat10n
Advanced data visualization, mapping & communication
Informat10n is working towards a mini-revolution in data visualization and communication. We develop interactive information resources and applications using 3D technology.
Our interactive software can be shared worldwide, either as a downloadable application, or as an online resource. It is a powerful tool for creating attention-grabbing content and can be used as part of live presentations and interactive reports. Any kind of data can be presented in a clear, functional and beautiful way. Our animated visualizations are a powerful tool for communicating complex information. They can engage new audiences and inspire them to explore and understand the story behind your data. We also create advanced 3D maps that allow users to explore any topic at a global, national or regional level.

Data visualization
Any type of data can be transformed into a beautifully informative data visualization. These can be used to clearly communicate information in an accessible and understandable way. Charts and infographics can be animated to show changes over time and to present complex data in a structured and digestible format. Users can interact with the data and focus on specific factors or cases in detail.
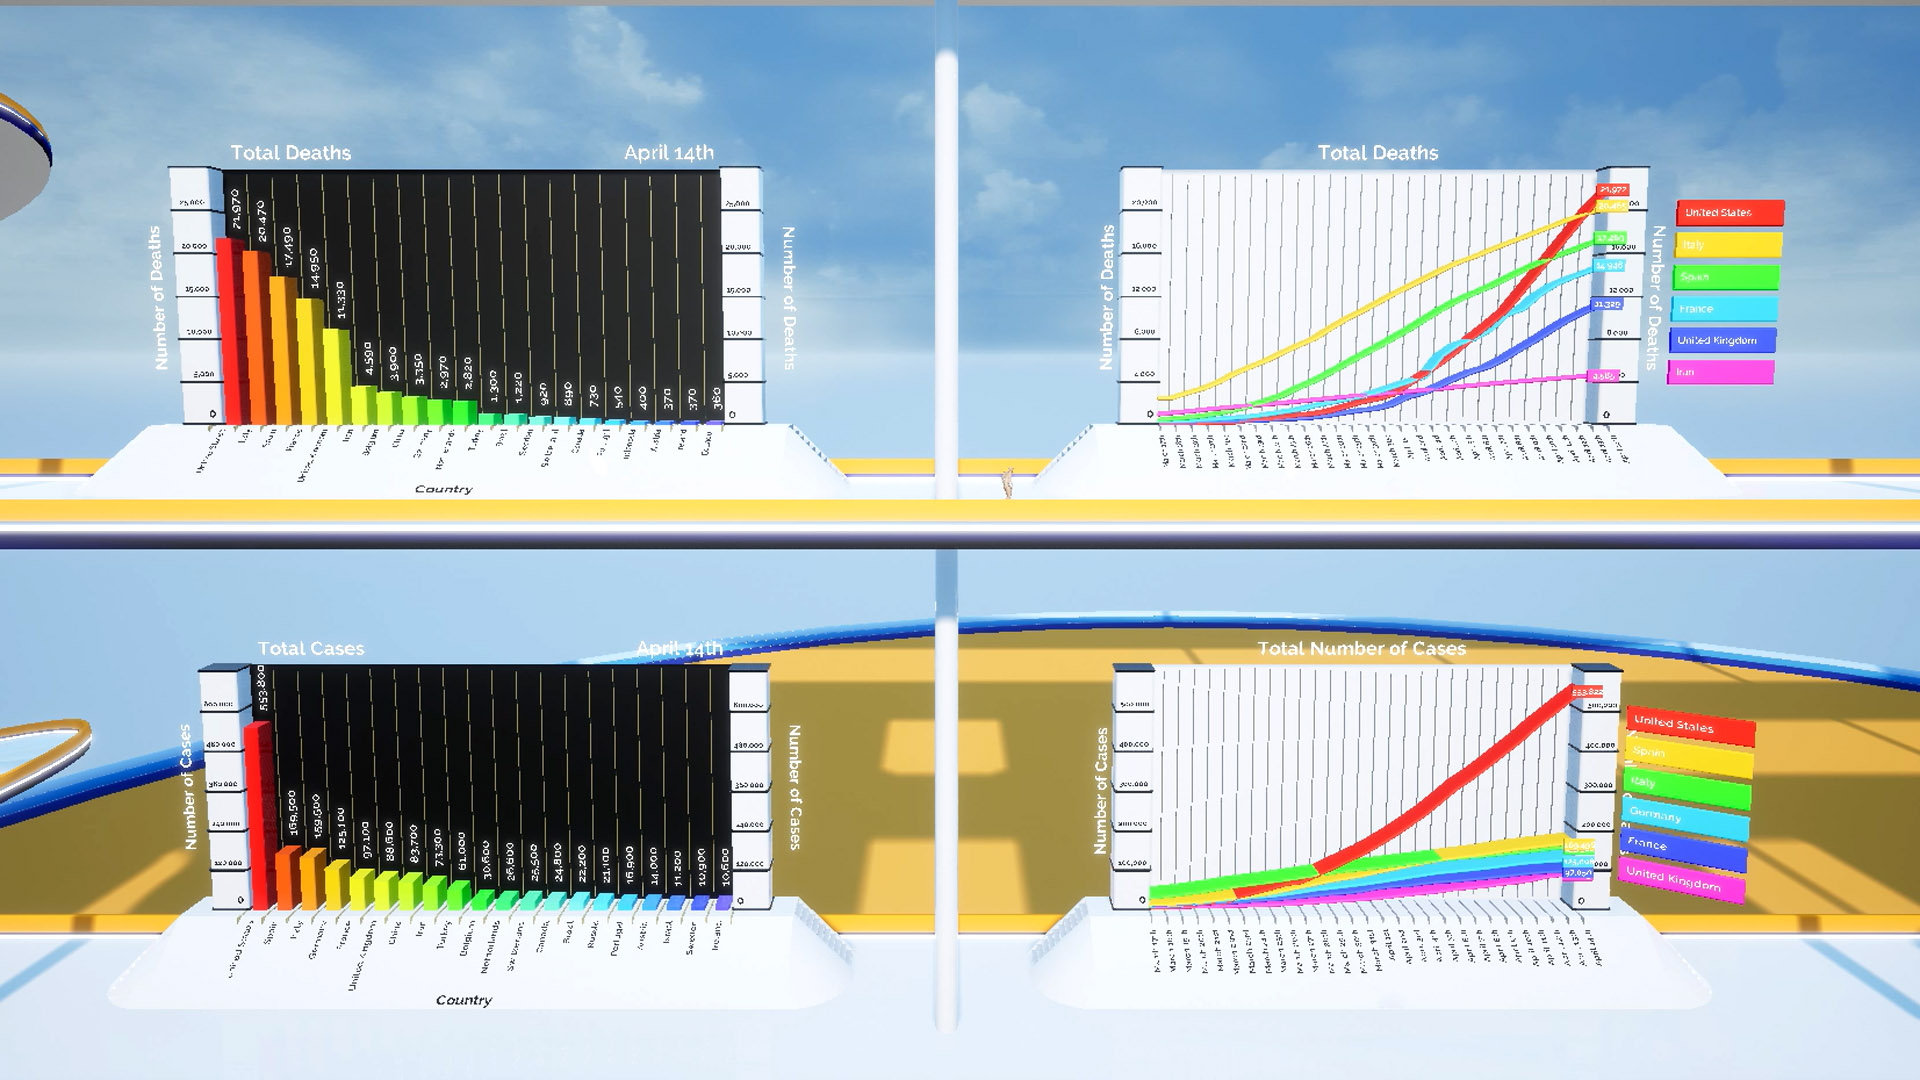
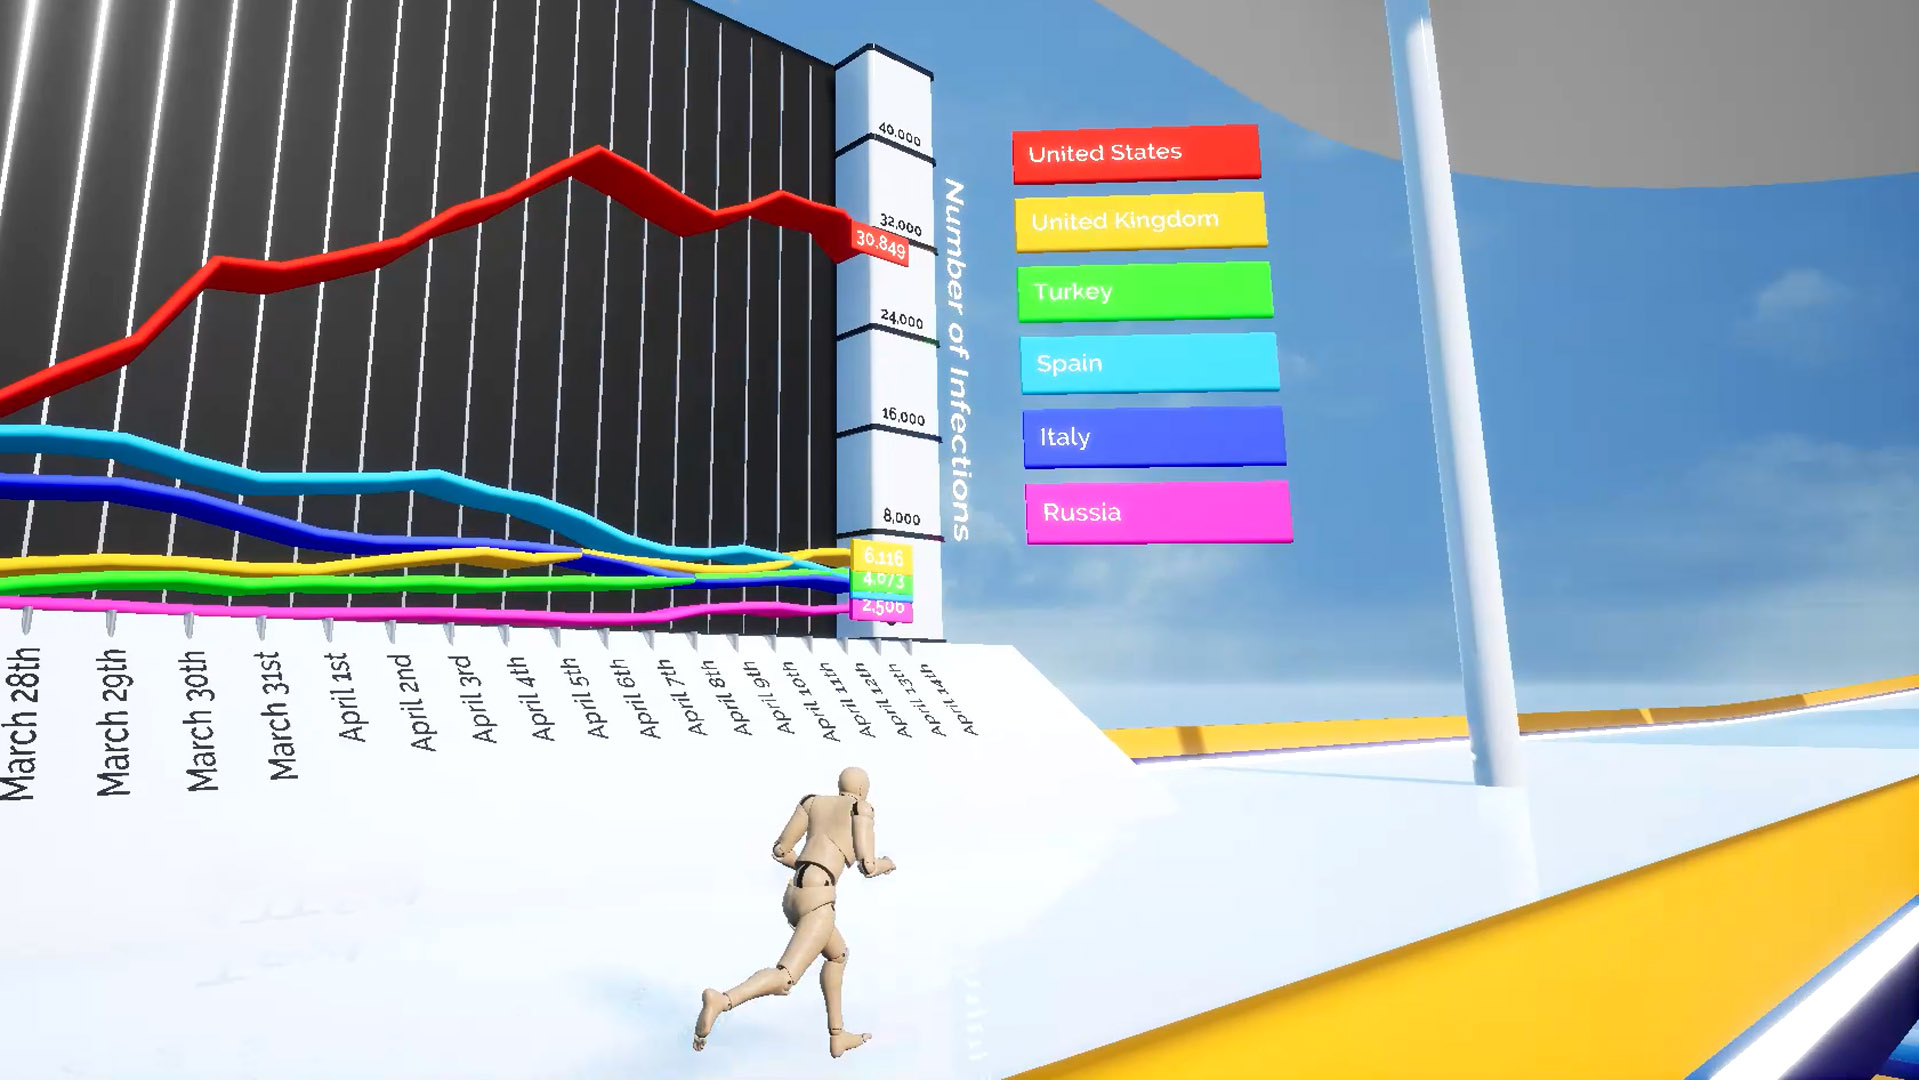
Covid-19 Data Project
The spread of the Covid-19 virus is a global issue. It not only affects people personally, but is likely to have significant long-term implications for economic systems, political decision-making and healthcare. This Coronavirus data project presents data that has been gathered from international sources. The aim of the project is to provide an online and shareable resource that is engaging and understandable for a wider audience.
The Illuminate Project
The Illuminate Project is an opportunity for anyone to turn some data into an animated visualization. We are inviting researchers, teachers and citizen scientists to submit interesting evidence to us. Each week we will select a set of data and transform it into an animated 3D chart. This data does not necessarily need be collected by you, but it must be in the public domain. If you have found something interesting or informative, send it our way and we will help share it with the world in a beautiful and engaging way.
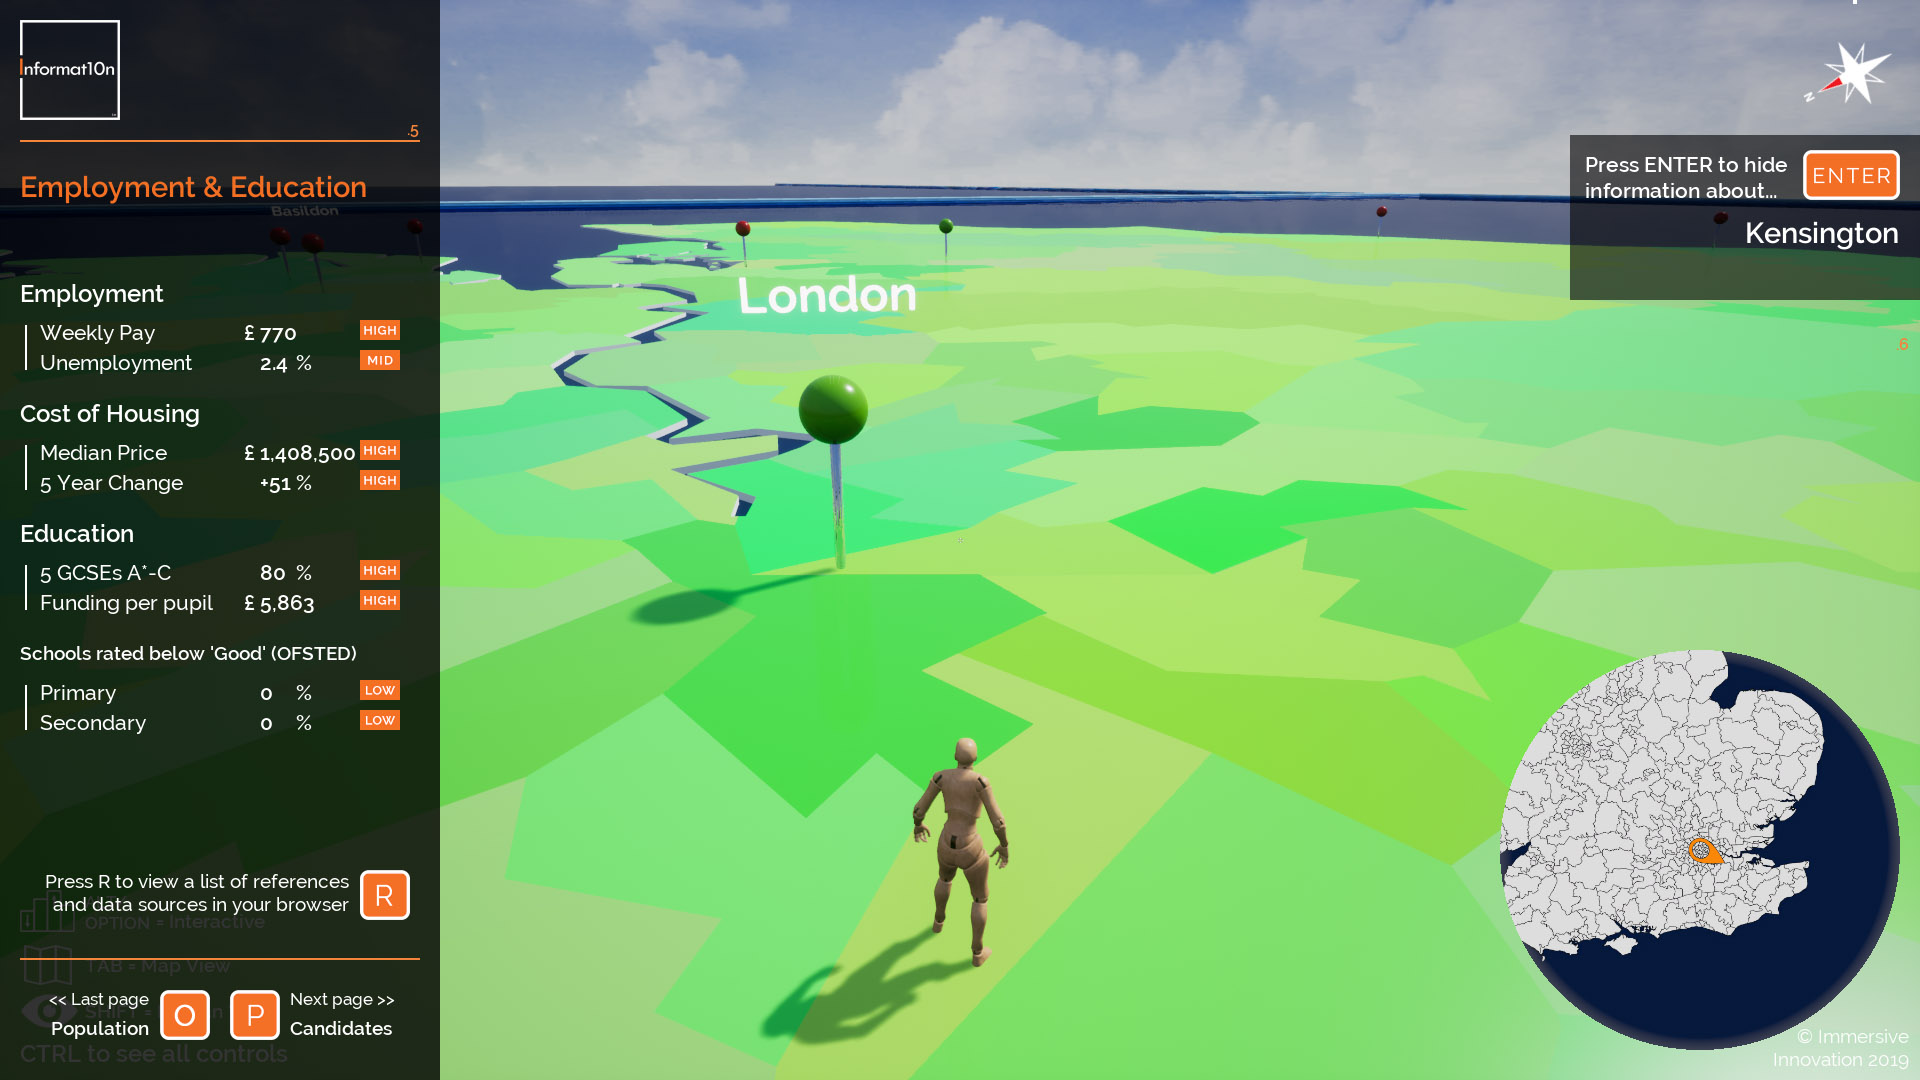
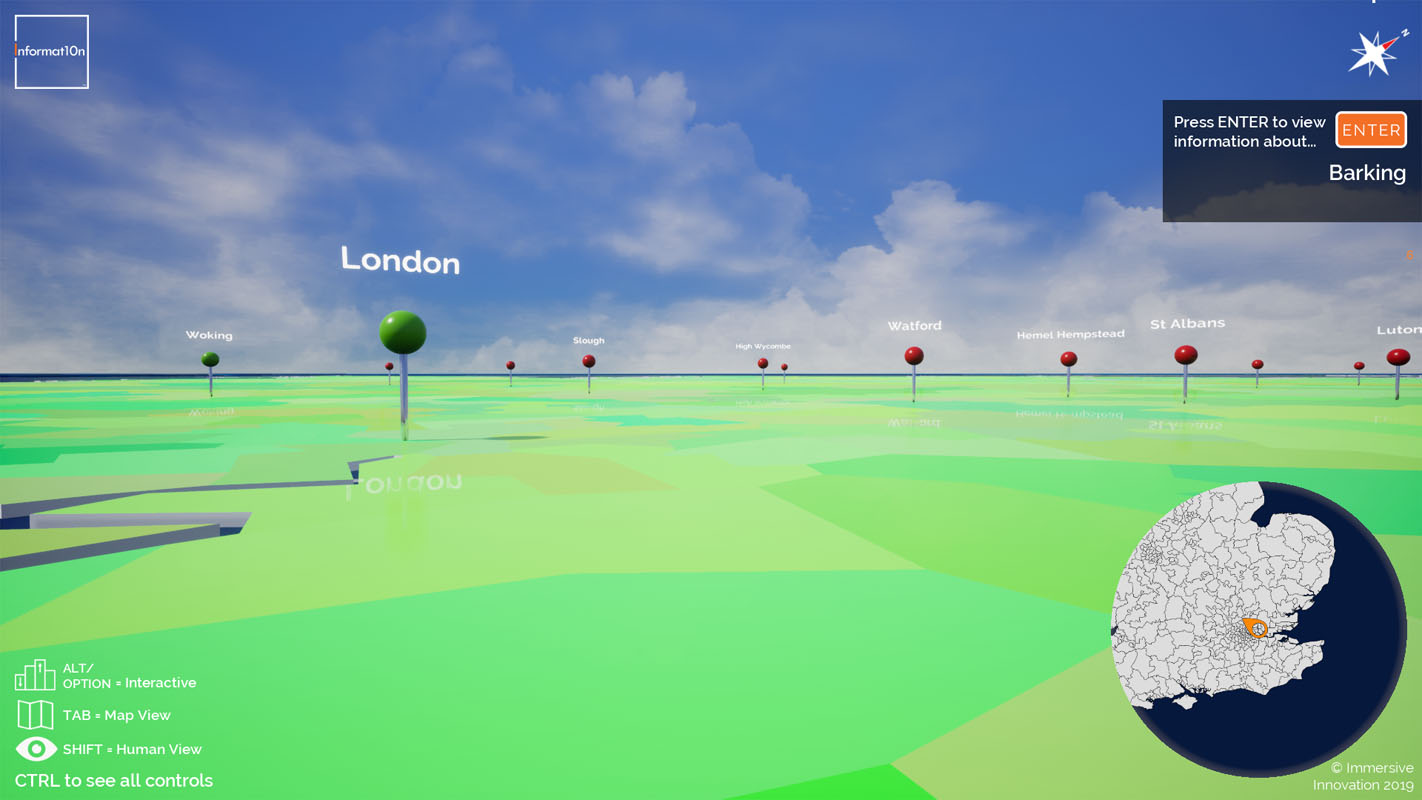
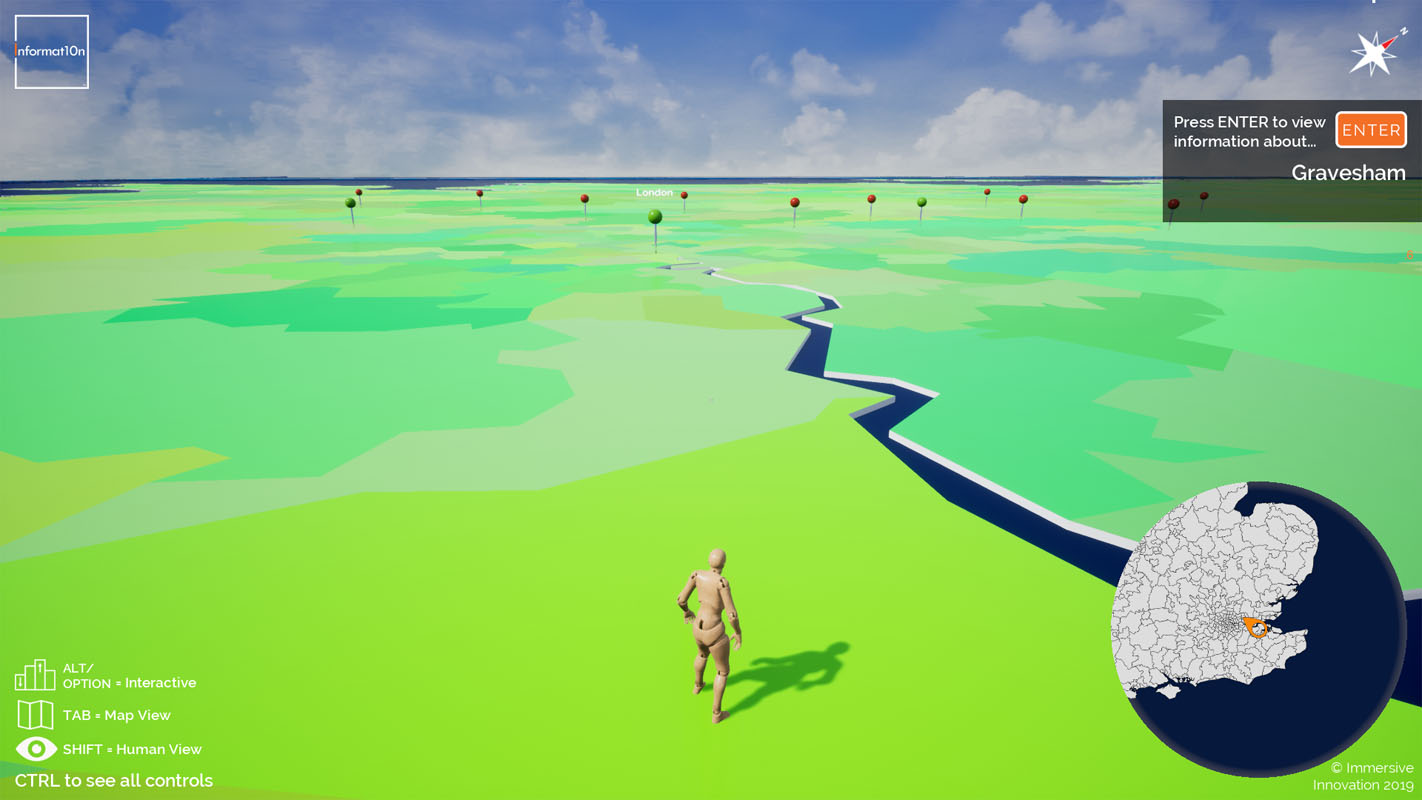
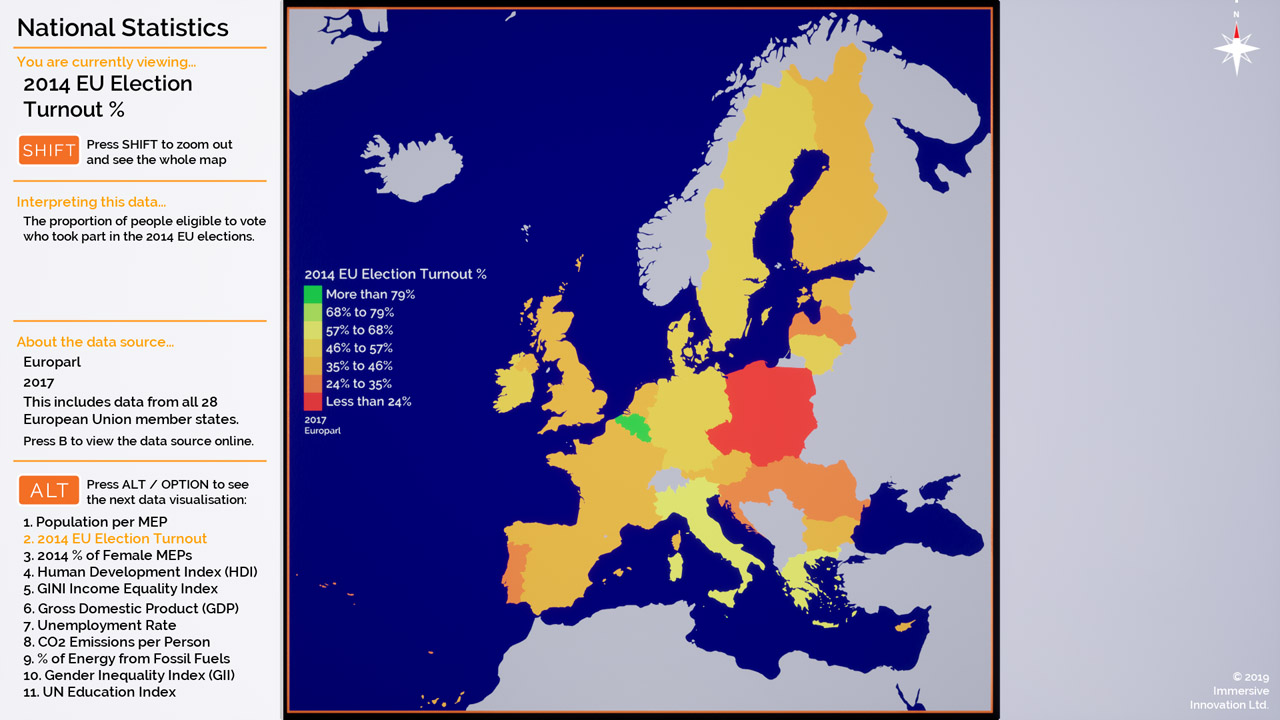
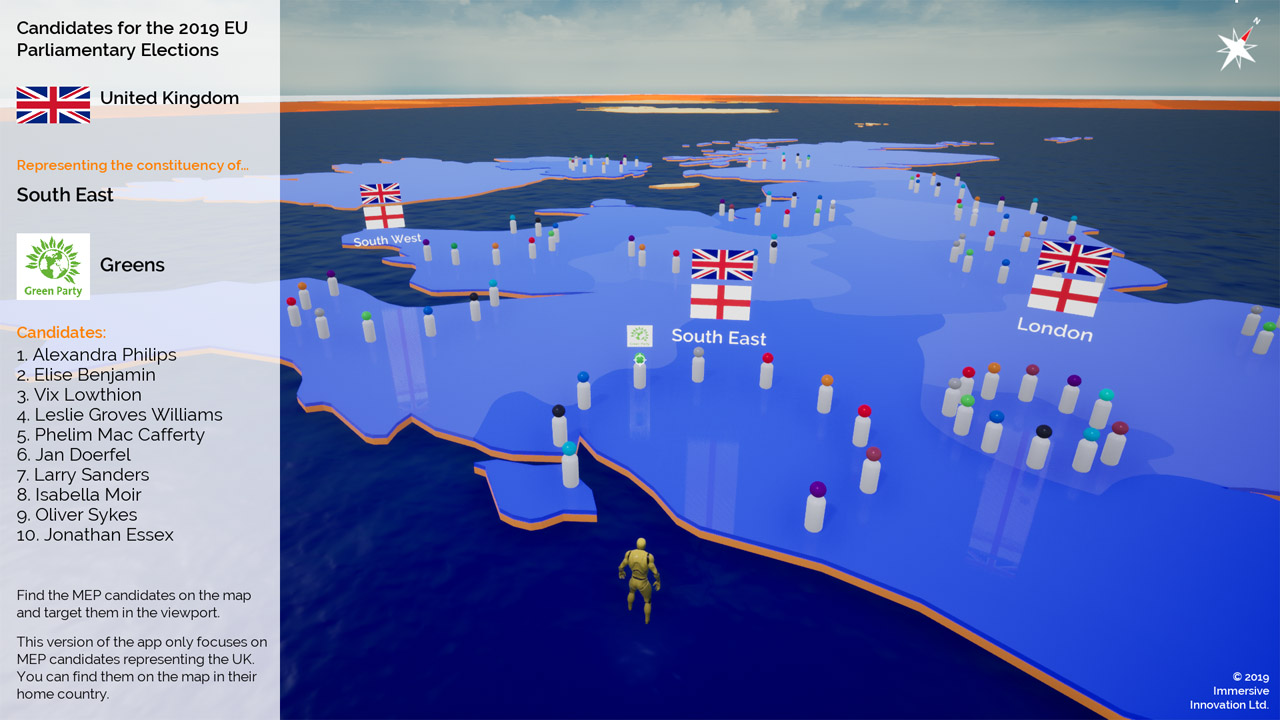
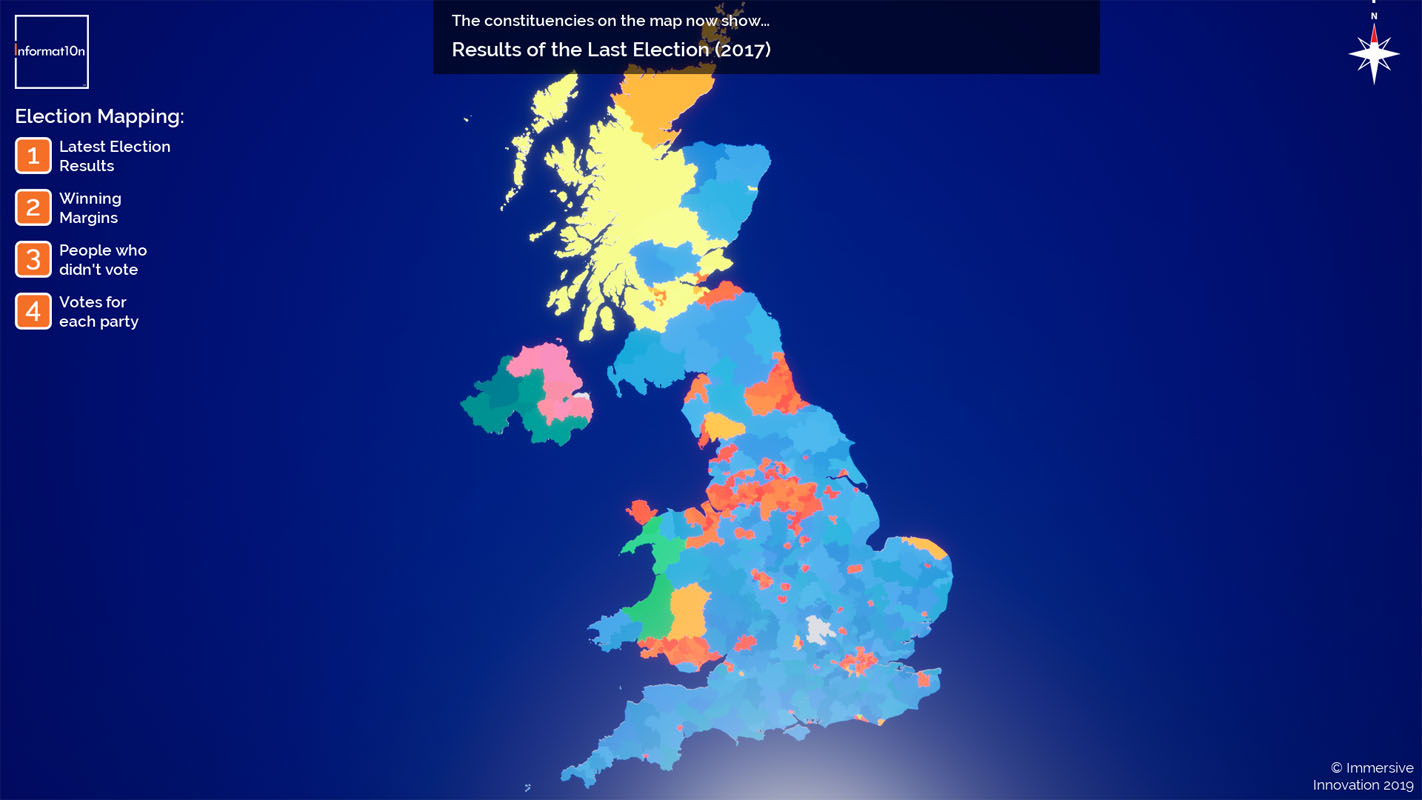
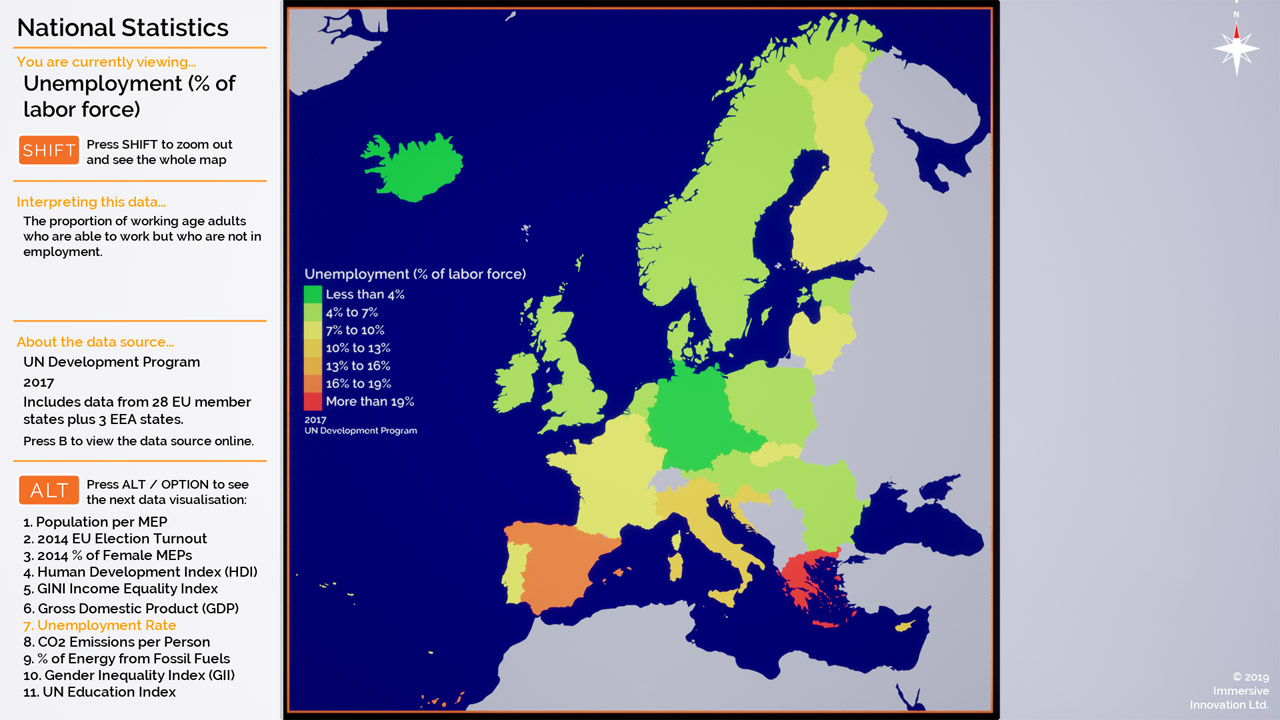
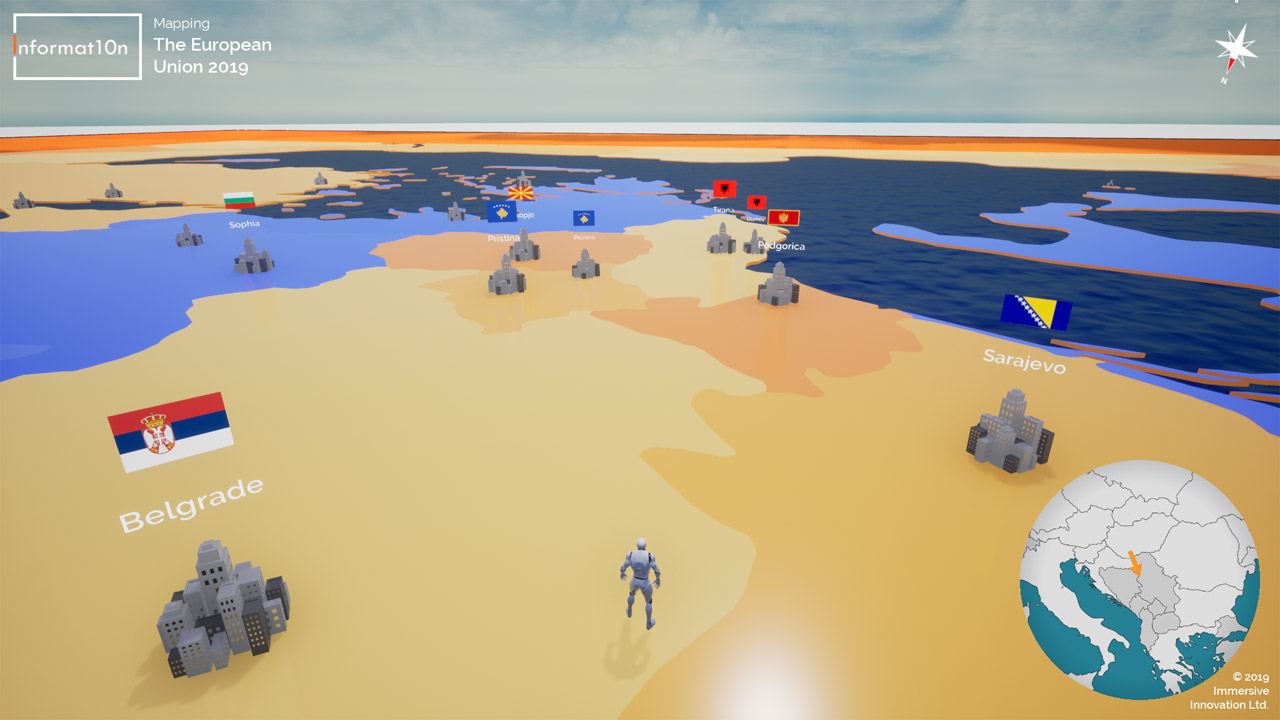
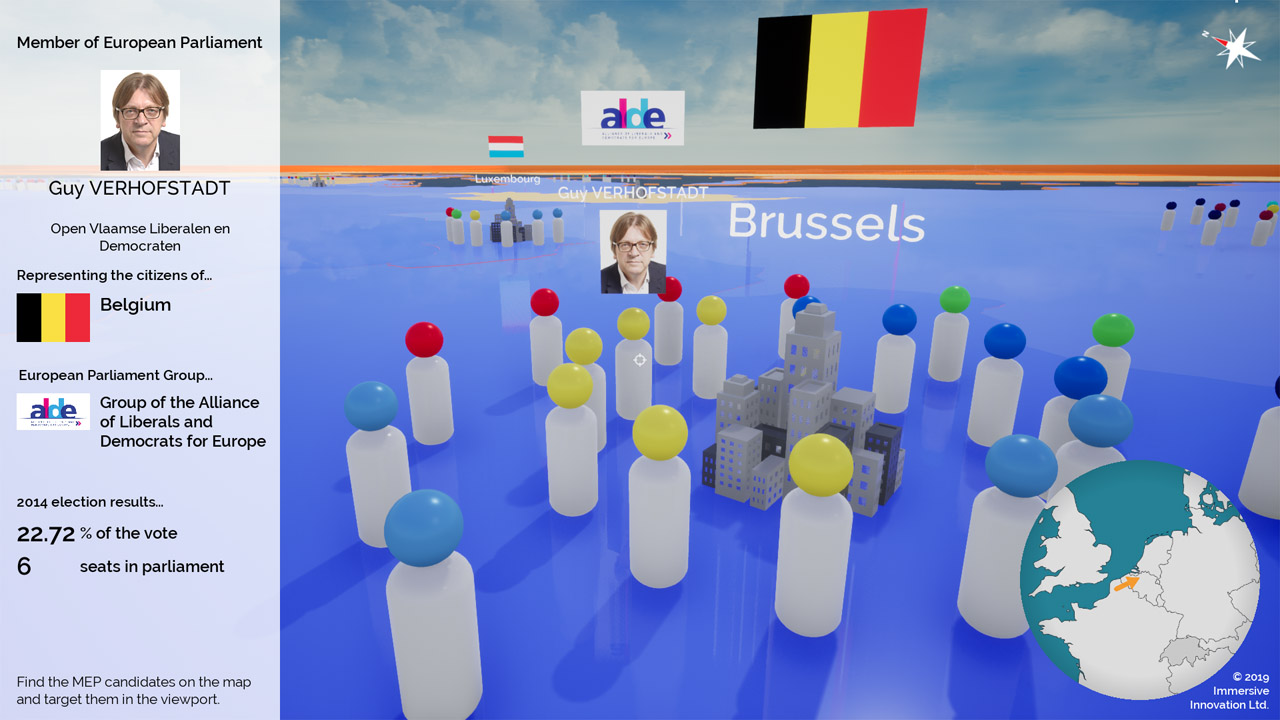
Society & Politics: UK
This interactive map allows users to explore information about constituencies in the UK. The aim of the project is to improve acces to public information, so that people can make informed democratic decisions, based on the issues that affect society.
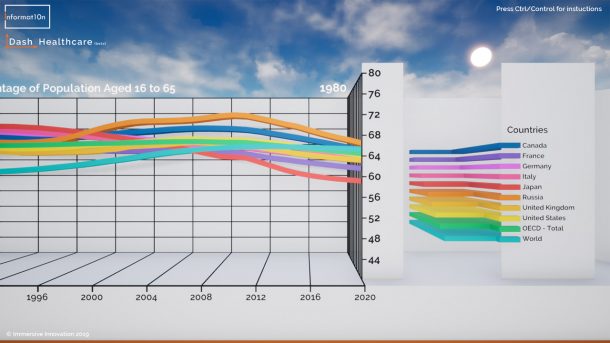
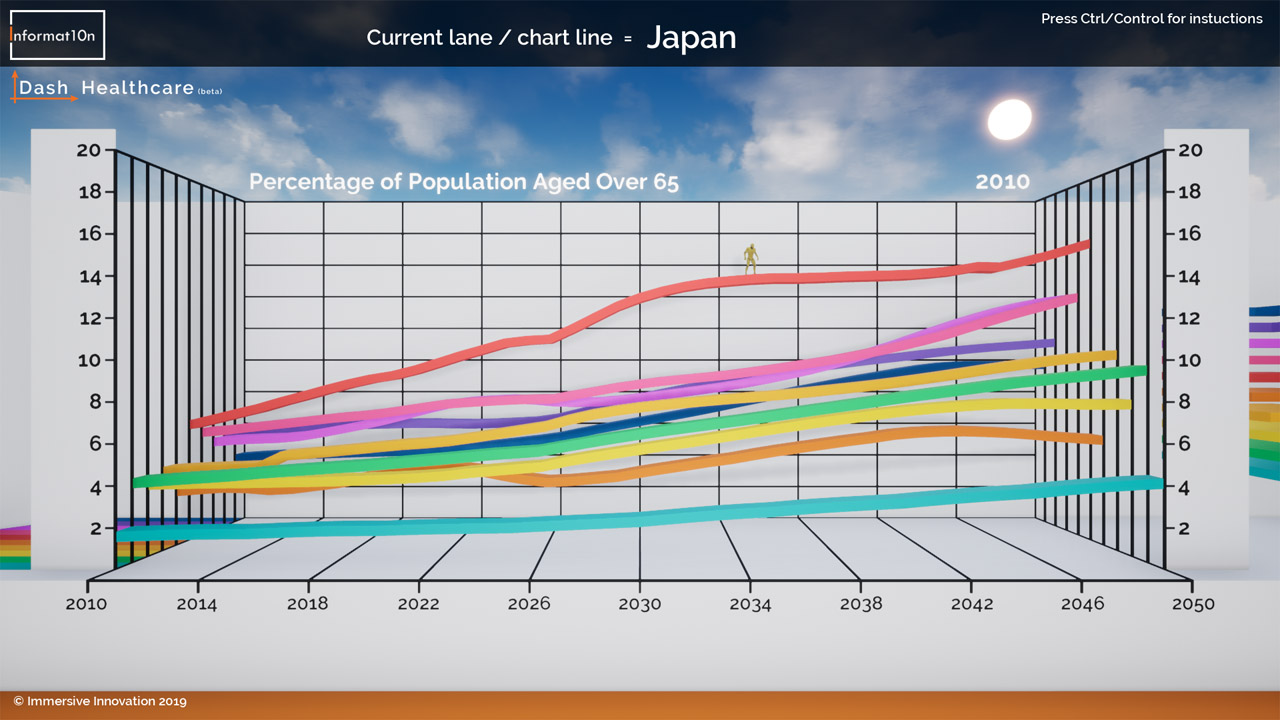
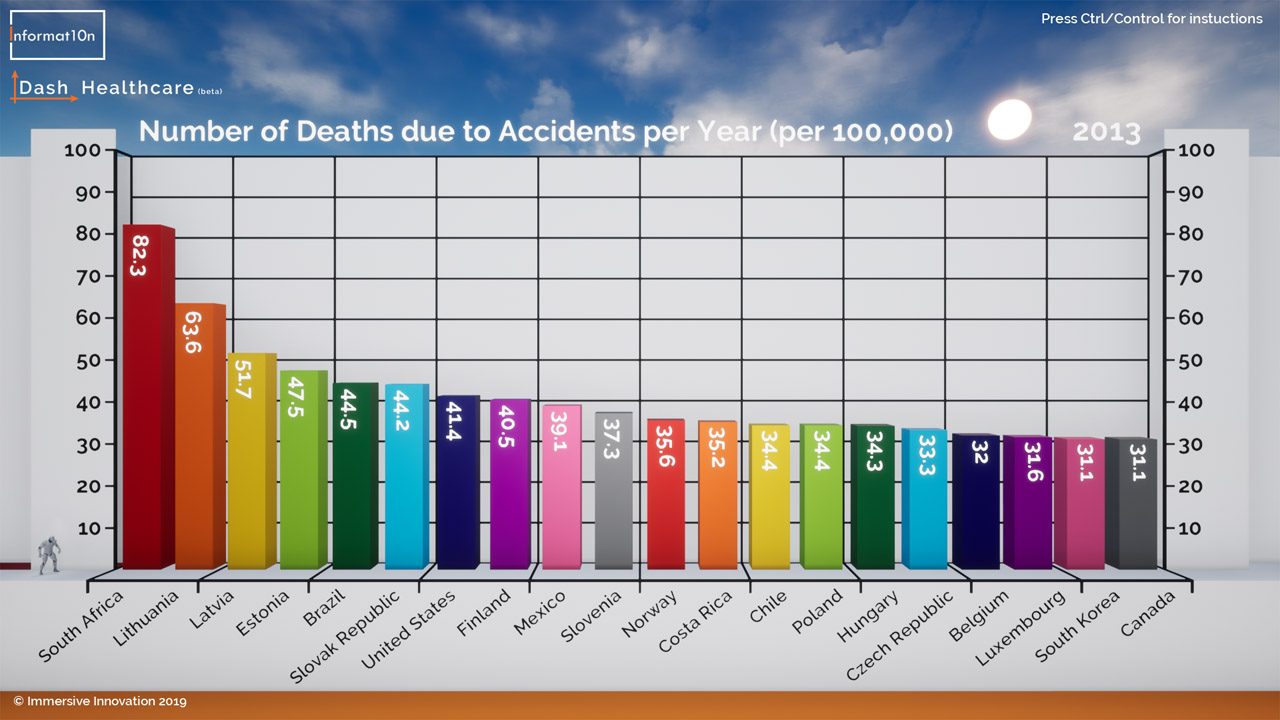
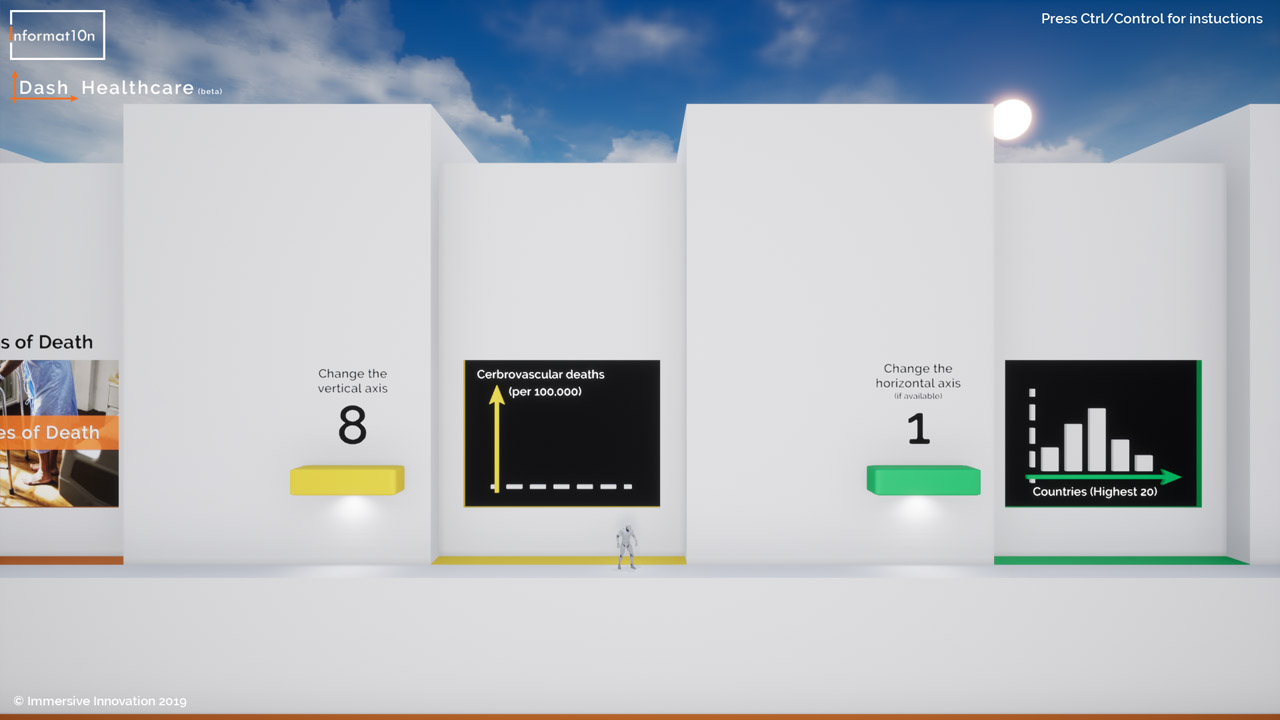
Dash: Healthcare
This is a cutting-edge piece of data dashboard allows users to explore international healthcare statistics in a way that is easy to use, easy to understand and beautiful to look at. It is designed to give all users an interactive, intuitive and engaging experience, with a focus on evidence-based learning and self-directed exploration.
Who uses Informat10n?
Researchers, analysts & decision-makers
Our apps can be used to explore information on every topic imaginable. They allow people to make sense of any type of data in relation to other factors, at a regional, global or universal level. Our apps can provide unique anlaysis and insights, presented in a concise, easy to understand and elegant way. They also give researchers and analysts an effective way to communicate their findings and to disseminate knowledge in a way that is both accessible and inspiring. Decision-makers can have access to clear and up-to-date evidence, which can help them to interpret trends, understand reality, and make well-informed decisions.
Teachers, lectureres and educational institutions
Teachers and lecturers can use our applications as part of their lessons, either by presenting information on a big screen, or by guiding students as they explore the interactive apps themselves. They can be used to prepare lesson plans and additional learning resources, or as a basis for curriculum design. Ourinteractive software can have a huge impact on learning and motivation, thanks to its user-friendly and accessible design.
Citizen scientists & curious individuals
Our apps are designed to communicate complex information in a user-friendly and accessible way. This makes it suitable for almost anyone, regardless of academic experience or expertise. In fact, one of the main reasons we exist is because we want to bring complex topics to a wider audience. We want every experience to be afun and efficient way to further one’s own understanding or to conduct research, whether it’s for work, study or simply out of personal curiosity.
Content Creators
It is easy to take screenshots and to record video whilst exploring our interactive apps. We do our best to communicate informatio in a clear and elegant way, which means there is little or no need for editing. Any screenshots and videos taken from our public projects can be shared under a Creative Commons “Attribution-No Derivatives” license. These can then be used for any (non-cmmercial) purpose, so long as you credit Informat1on and don’t edit the original content. If you have commissioned us to create something unique to you, then you own that content and you can use it in any way you wish.
& presentation images
Data visualizations, maps & presentation images


Contact Informat10n
Email: contact@informat10n.com
We are available 24/7 and can work with individuals, institutions and organisations from around the world.
We offer live demonstrations via Skype or Zoom.
Based in the London, we are also able to offer face to face meetings and demonstrations in the UK.
Further details can be found on our contact page >>