We design, develop & deliver interactive applications for sharing information
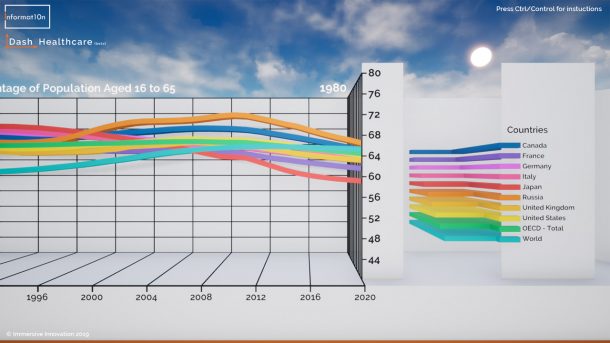
Immersive 3D visualisations are perfect for presentations & reports that will inspire, inform and engage audiences. There are many possibilities when it comes to their features & uses. Our design & development services are bespoke. Once we know what you want and the data that you want to present, then we will discuss your options and give advice. Together we will decide on the design brief, timescale and costs for the project.
Share insights, communicate and make an impact!
We know that interactive 3D applications are a fairly new concept which may be unfamiliar to some people. Interactive applications are easy to use, easy to understand, cost-effective & flexible. We will guide you through the design process every step of the way. We are proud of what we do and want to tell the story of your data in the best way possible. The aim is to leave a lasting impression on your audience so that you, and they, can use evidence and understanding to improve the way things are done…in any field or industry.
On this page you will find a description of our services and the features that can be included in our applications and interactivee presentations.
We have also put together a brief introduction to interactive 3D data visualisations. Here, we answer the 5 key questions that people have. You can skip to this section at the bottom of the page by clicking here.
What can we do for you?
Informat10n services and application features

Data Sourcing & Analysis
Data. Evidence. Information. It’s the basis for every visualisation, report or story that we share.
If you’ve got the data then we can turn it into something powerful and inspiring.
If you haven’t got the data (or even if you’ve got too much) then we can find it, tidy it up, conduct the right analysis and produce the numbers that you need.
Our in-house research will identify sources, organise information and put together a report on your topic of interest. All evidence will be meticulously referenced, robustly analysed and accurately reported. We will then present it in a way that tells the story of the data in a compelling and insightful manner.

Secure Circulation for PC, Mac or Mobile
All our apps are made for both PC and Mac. These can be shared via a unique download link, which can be sent as part of an email, or which can be added to your web site. This allows your audience to easily access the application and view it on their own computer. These web links or pages can also be password protected is necessary.
If you want to make your data visualisations publicly available then they can be shared easily on your web site, on the Informat10n web site, or on the digital distribution platform Steam.
You can also choose to develop your 3d application for mobile devices. The application would then be listed on Google Play or the Apple store, making it accessible to just about anybody with an Apple or Android device.
Whichever method you use for distribution, it is also possible to monetise your application and charge people for access. Alternatively, it could be offered as part of a subscription or after signing up to an online account.
Whatever you choose to do, it’s easy to share information and insights quickly and easily anywhere in the world.

Compelling Narratives & Exploration

Mapping & Geographical Data

Real-Time Presentations & Demonstrations

Cost-Effectiveness & Added Value

Interactive Reports & Data Visualisation

Powerful use of Video & Sound

Bespoke Development & Content Creation
A Brief Introduction to Interactive 3D Data Visualisations (by Informat10n)
1. What are they for?
Data Visualizations are designed to present complex information, evidence or data in a way that is inspiring, engaging, functional & easy to understand. Interactive 3D applications allow you and your audience to explore a 3D world of your own design. This allows you to create a narrative journey, guiding your audience through the data and the insights that you wish to present. It also give users the flexibility to explore in their own way, making it more engaging, memorable, entertaining and immersive.
Most of the information we consume every day is given to us in a linear format. For example books, reports, articles, audio & video recordings. These sources of information all serve their purpose and they have become the norm. We are moving these conventions forward by using interactive technology. This allows publishers and information providers to use an immersive mixture of text, images, infographics, sound, video & 3d visualisation to present evidence and tell their story.
2. Who are they for?
The short answer is that they can be useful for anyone who wants to present information, data & evidence in the best way possible. Interactive projects are best suited for medium to large scale projects, where there is a good amount of data to explore. They become more cost-effective when they are intended for a larger audience (at least 50) – and therefore take advantage of easy online sharing via email or download.
Interactive applications are used by publishers and researchers to create information resources, which they can then deliver to their audience. They may wish to disseminate information within their organisation, or they may wish to monetise their interactive application by selling it publicly through an online store.
3. How do people use them?
After creating an interactive 3d application, it can be shared privately via an email link or web page, or publicly via a download platform such as Steam, Google Play or the Apple Store.
The user can then download a file to their PC, Mac or mobile device. This can then be ‘played’ freely and used in any way they wish – to explore the information presented within the interactive 3d space. They may use it as part of their work, training, school or university studies, or for personal development and self-interest.
Publishers and content creators can use interactive applications to spread information about a topic and to inform the wider public. Not only is it possible to share the 3d application itself, it is also easy to create further online content easily – by recording videos, taking pictures and making sound recordings. This allows further propagation of information by using social media and other channels.
It is an incredibly flexible medium for communication, with a lot of potential for how it can be applied.
4. How much do they cost?
Interactive 3D visualisations sound very technical and complex, but that does not mean that they are exclusive or expensive. We can develop applications to suit any budget, from as little as £1200.
All our applications are high quality, professionally designed and packaged for PC and Mac. Every project also comes with it’s own personalised web page, so that you can promote and share the application easily (via download) even if you don’t have your own web site. This page can be password protected, allowing you to give secure access to your users as you wish.
We want to make these applications accessible to as many people as possible. You can develop a shareable app for the same price as a written report, a presentation or a series of infographics.
All of the information you might usually publish as a traditional text document, Excel spreadsheet, data dashboard, slideshow, video or web page – can be transformed into something that will engage, motivate and inspire your audience.
5. What are the features?
This is the fun part…because there are so many possibilities.
The best way to start is to get in touch with us and tell us about the data, information and knowledge you want to communicate. We can answer any questions and will reply to your enquiry quickly. Contact us here.
You will find a description of our services in the section above. This also gives details about the features that can be included in an interactive project. But there is always room for creativity. If you have an idea of what you want, just ask us and we’ll tell you if it’s possible. It usually is.
You can skip to the services description above by clicking here.
Or sign up to our newsletter below to receive info about our public projects and new developments.
Contact Informat10n
Interactive 3D visualisations are perfect for presentations & reports that will inspire, inform and engage audiences. There are many possibilities when it comes to their features & uses. Our design & development services are bespoke. Once we know what you want and the data that you want to present, then we will discuss your options and give advice. Together we will decide on the design brief, timescale and costs for the project.
Contact our small friendly team to find out if interactive data visualisations are right for you. You can use the contact form or send us a direct email to info@informat10n.com. Leave your phone number if you would like us to call you back.
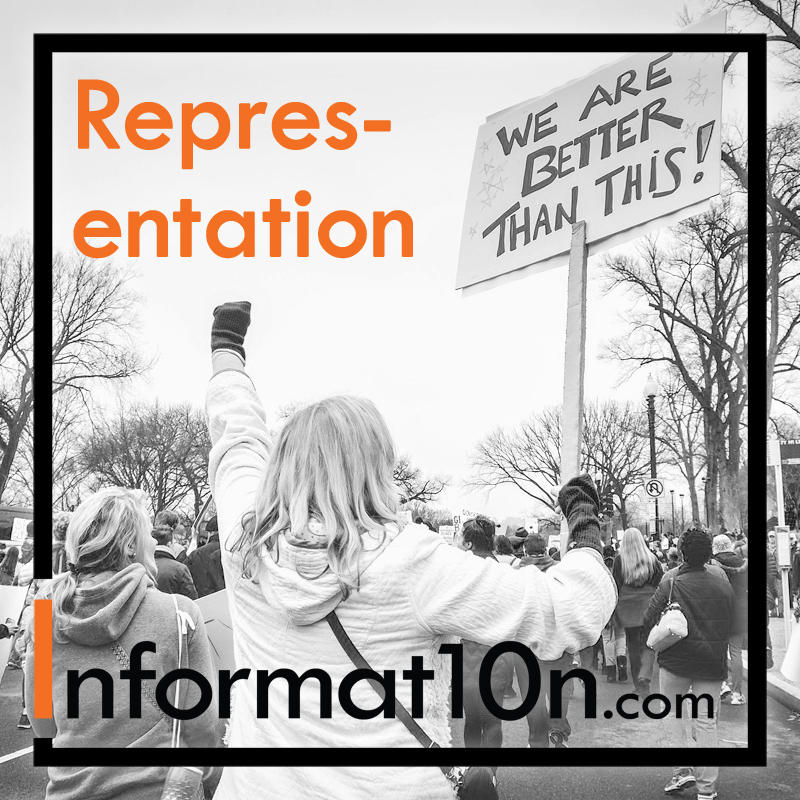
Representation
“Politics & Society”

Human Migration
“Anthropology & Human Rights”

All the Money in the World
“Economics & Society”