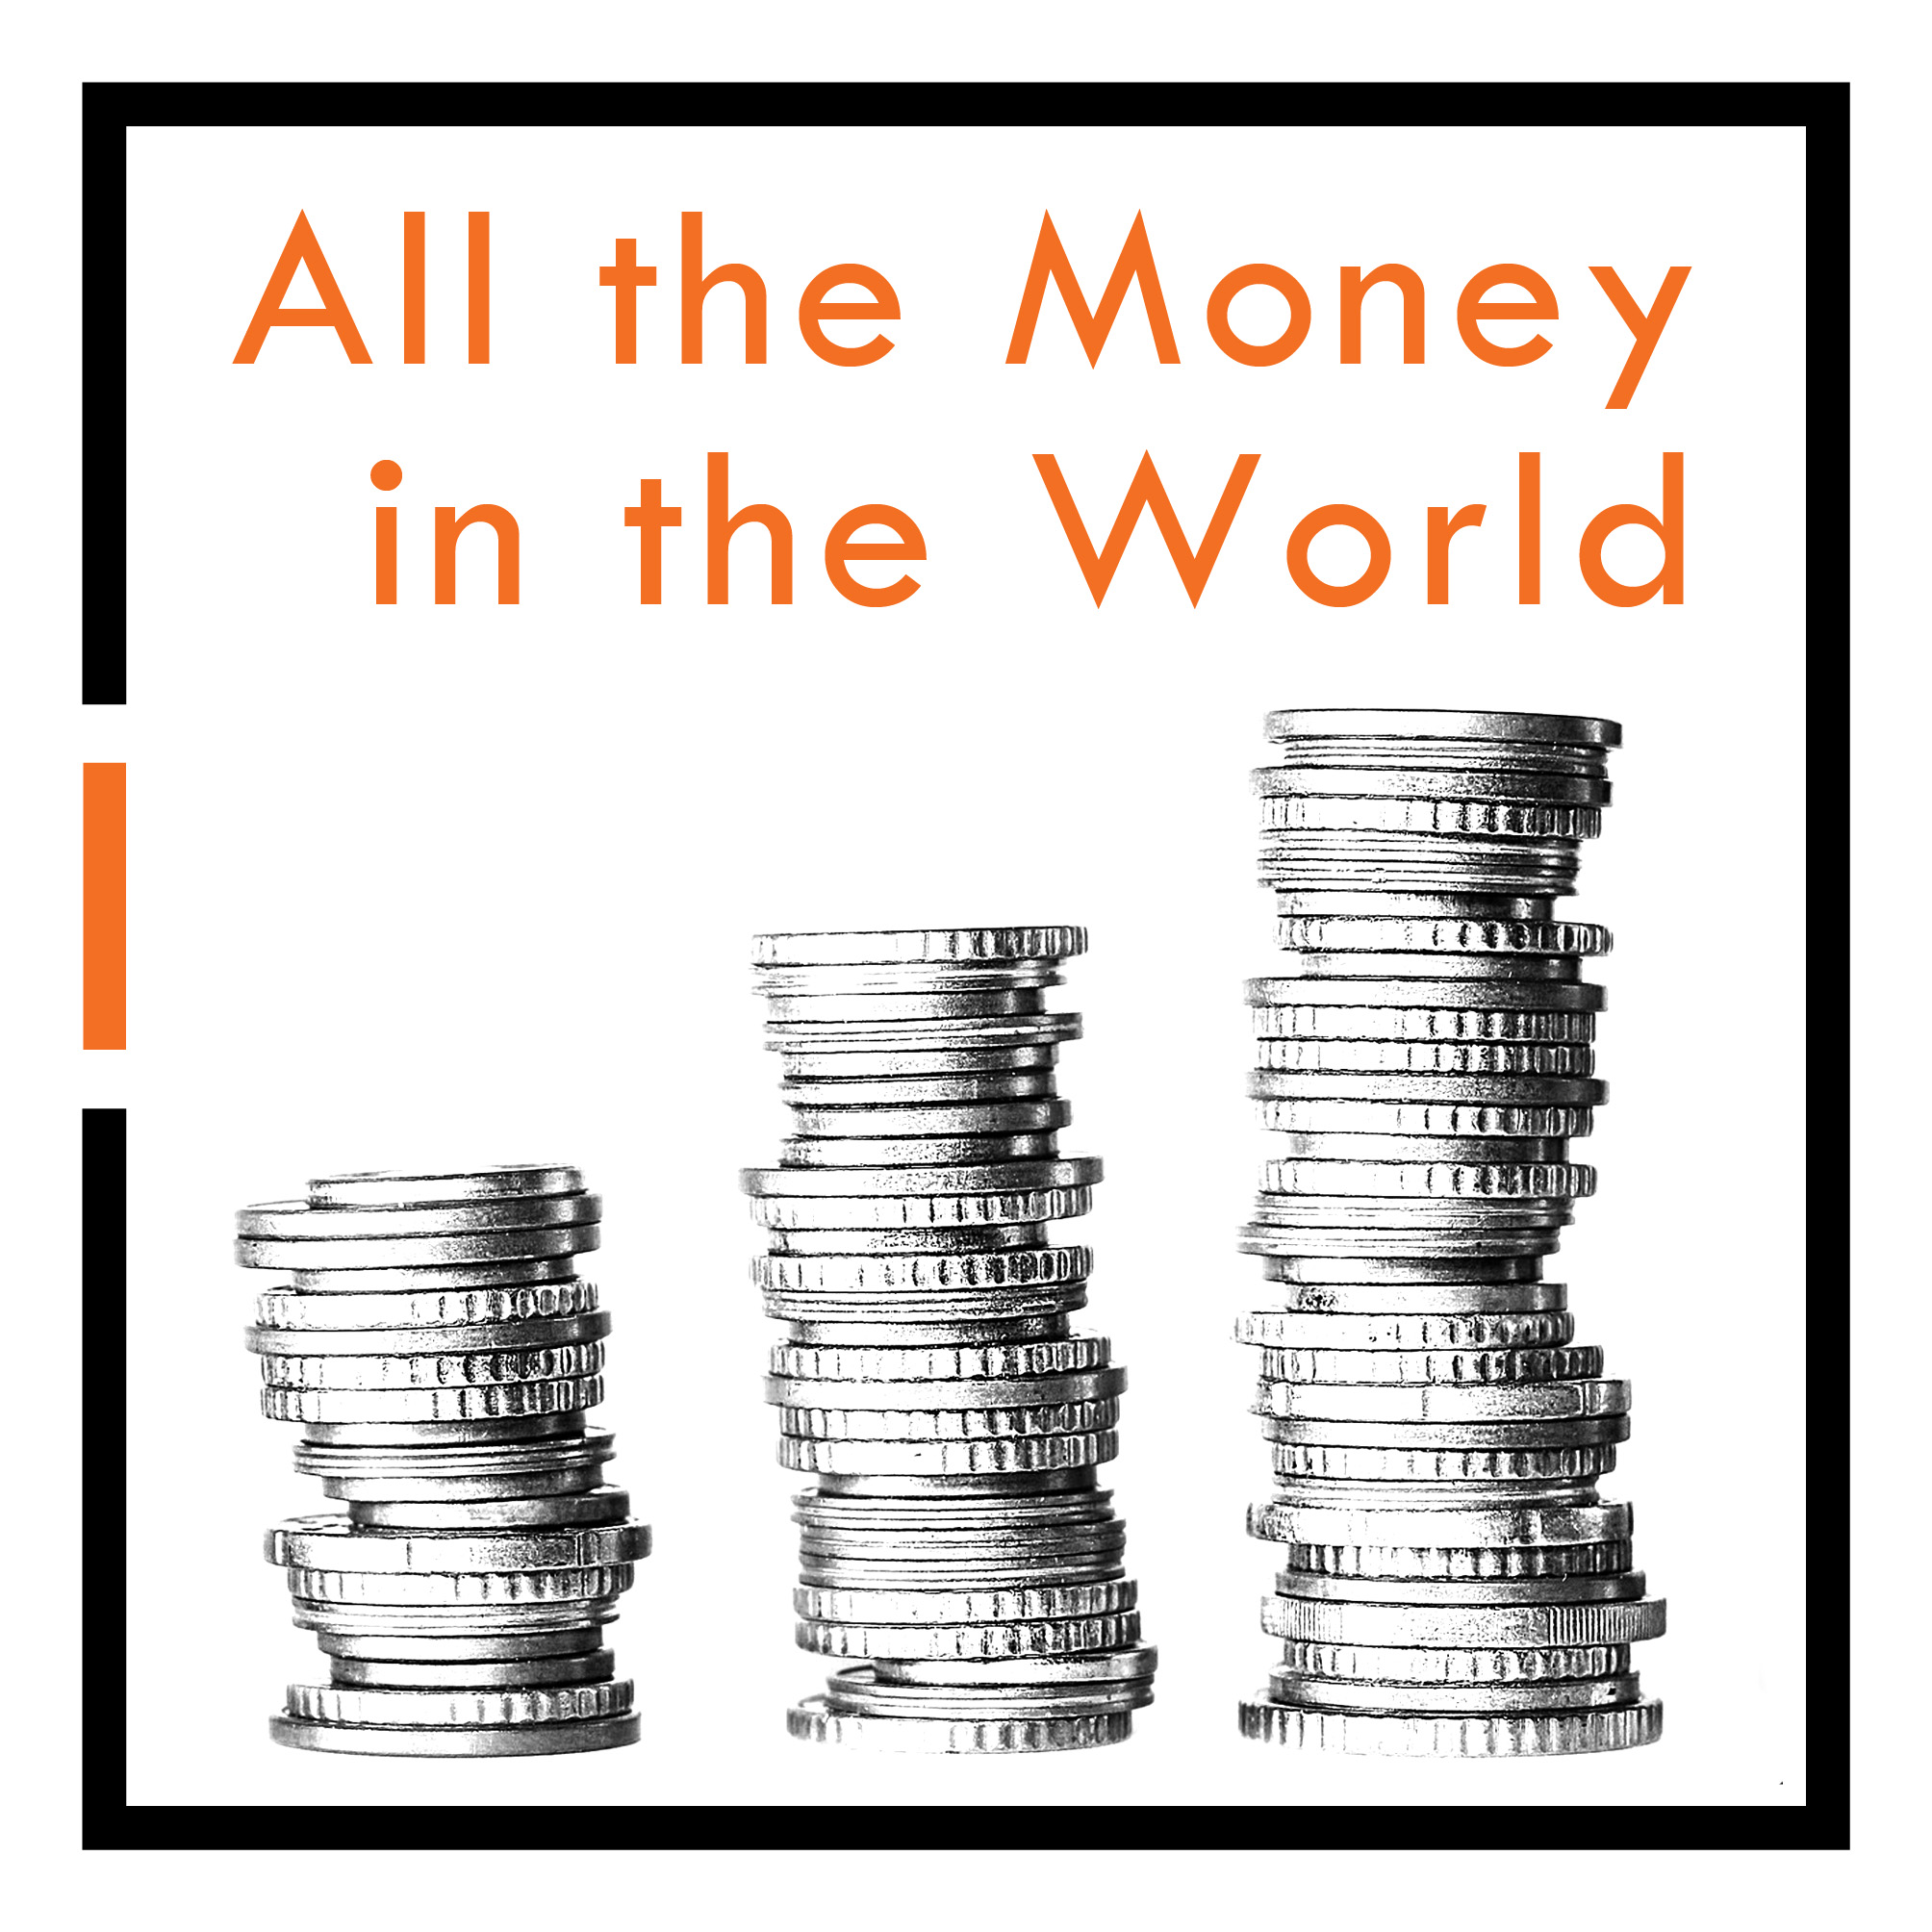
All the Money in the World
“All the Money in the World” is an interactive and downloadable application exploring the global monetary system. It presents information about many forms of capital, currency, assets and industry worldwide. It’s goal is to give a complete picture of how the global financial system works, what constitutes wealth, and who owns it. This app also shows how worldwide financial markets change over time, using data visualization and animation to introduce this complex topic in a fun and accessible way.
Users can explore a 3D world map, gain insights into the econimcs of individual countries, and see how transactions take place. It offers a holistic and wide-angled view of the world and the capital that drives so many aspects of society, politics and culture.
Who is it for?
This piece of software allows users to immerse themselves in a complex topic and to quickly develop their understanding of it. It is a powerful tool which provides a rich source of information and an engaging medium for communicating evidence, ideas and insights.
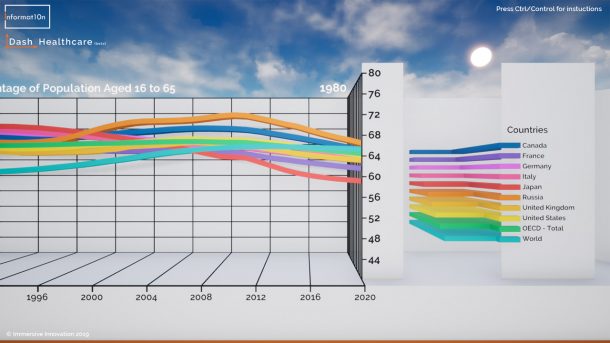
- For researchers, analysts & decision-makers: It can be used to quickly find information about global and regional economics. It allows people to make sense of this data in relation to other social, cutural and economic factors. All the information included in this app is accuratley sourced and cited. It also includes unique anlaysis and insights, presented in a concise, easy to understand and intelligent way. Decision-makers have access to up-to-date and useful evidence, which can help them to interpret trends and make well-informed decisions.
- For teachers, lectureres and educational institutions: Teachers and lecturers can use this application aas part of their lessons, either by presenting information on a big screen, or by guiding students as they explore the interactive app themselves. It can be used to prepare lesson plans and additional learning resources, or as a basis for curriculum design. It can have a hug impact on learning and motivation, thanks to its user-friendly and accessible design.
- For citizen scientists & curious individuals: It is designed to communicate commplex information in a user-friendly and accessible way. This makes it suitable for almost anyone, regardless of academic experience or expertise. It is a fun and efficient way to further one’s own understanding or to conduct research, whether it’s for work, study or simply out of personal curiosity.
- For Content Creators: It is easy to take screenshots and to record video whilst exploring the interactive app. Any screenshots and videos taken from the application will be shareable under a Creative Commons “Attribution-No Derivatives” license, meaning that people who have purchased the app are able to use these for any purpose, so long as you credit Informat1on and don’t edit the original content.
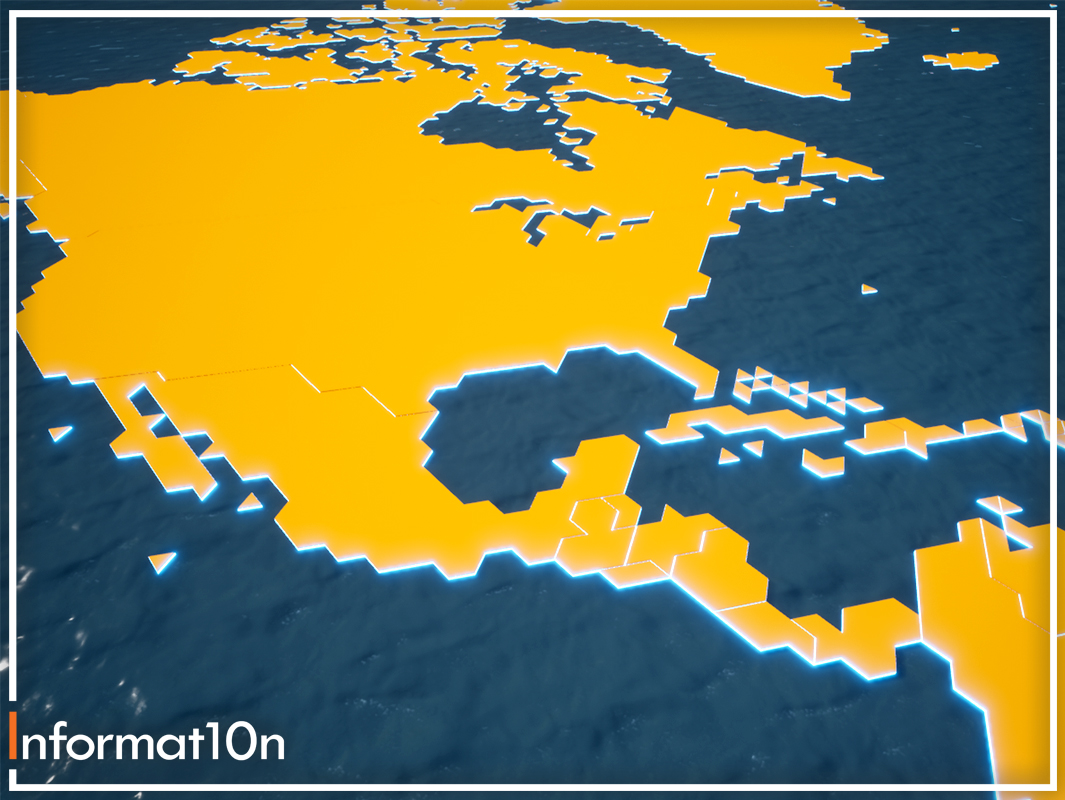
Visualize capital, assets, industries and financial movements around the globe

How & where can I get it?
The initial release will be available for download via the Informat10n web site.
We aim to make our applications accessible to as many people as possible. This means we develop them so that they can run on a wide range of computers and devices. It also means that we make them affordable.
- Individuals will be able to download the application and accompanying resources for a one-off payment.
- Organisations will be able to purchase a multi-user licence, which allows them to use the application within teams, classes, or for public display.
- Original video content will be available for free. Individuals and organisations who have purchased the application will be free to create and broadcast their own original content using the app.
Contact Informat10n
Interactive visualizations are the best way to inspire, inform and engage audiences. Our design & development services are bespoke. Every application we make is tailored to your data and whatever you want to communicate. Once we know what evidence or narratice you want to present, then we can decide on the best approach.
Contact us to find out how an interactive data visualizations can help you to influence people, change minds and inspire action. You can use the contact form or send us a direct email to contact@informat10n.com. Leave your phone number if you would like us to call you back.